

Image: NickyPe
Bubble Overvaluation:
- OECD model—reference period from 1983 to 2024—bubble overvaluation 110% as at the end of 2024.
- OECD model—reference period from 1991 to 2024—bubble overvaluation 66% as at the end of 2024.
- The Empirical Demand Attribution Price Model—bubble overvaluation 84% as at the end of 2024.
- The Market Structural Shift Graphical/Regression Model— bubble overvaluation 87% as at the end of 2024.
(Questions are asked egarding this policy driven catastrophe of Mr. Albanese, Mr. Taylor, Mr. Canavan, Senator Hanson, Senator Waters, Governor Bullock, Mr. Comyn, Mr. Miller, Mr. Irvine, Mr. Matos, Ms. Wikramanayake, Dr. Luci Ellis and Michele O’Neil (ACTU) midway down the article.)
In 2003 the IMF issued a warning—“the Australian housing market had entered a speculative period resulting in a housing bubble”—this astonishing insight was brought on by the fact the Australian real house prices had exploded to increase by 50% in just over three years— see Label 1, Figure 1 below. It is clear that the warning dampened exuberance but not for long and two other thing are also apparent from the Figure— that the speculative 50% price increase has not yet corrected out and the only thing that slowed explosive price growth over the decades was a an investor credit squeeze and fear of recession.
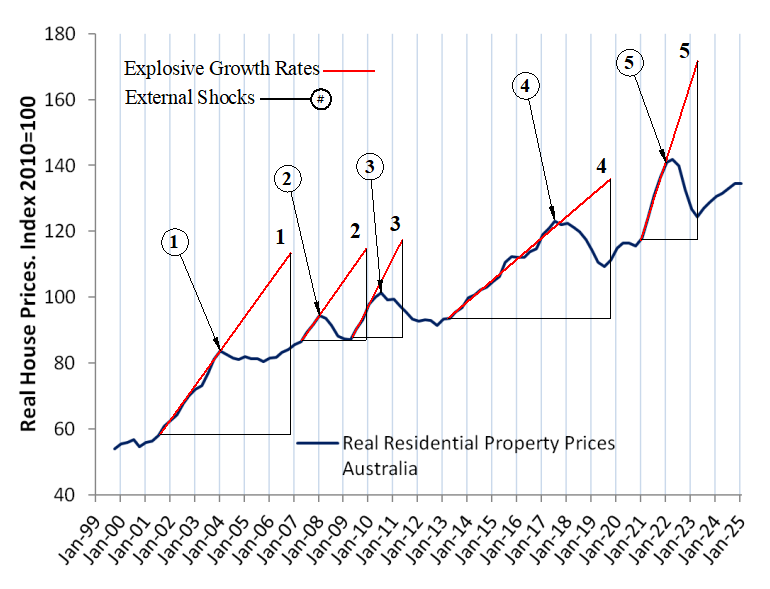
Figure 1. Australian Housing Market Price Growth Characteristics. Explosive growths rates halted by external recession threat shocks—triggering sharp declines.
Legend of Recession Threat Shocks:
1—2003 IMF warning of Australia in a housing bubble
2—Global Financial Crisis (GFC)
3—The European Sovereign Debt Crisis
4— APRA Credit Squeeze limits number of interest only loans by Banks
5— Russian invasion of Ukraine
Figure 1 shows the growth in house prices since the Howard and Costello 50% Capital Gains Tax (CGT) discount for property investors. Notably from Figure 1 also, Australian house prices are defined by explosive price rises followed by an equally explosive price falls where each price fall was some fraction of the preceding price rise—the symmetry of the price rise and fall for several price cycles resemble involute gear tooth profiles so whatever was driving Australian house prices clearly had very little to do with interest rates or population growth rates— that is, it had to be structural or “Acts of God”.
The market has been in a unique investor driven structural world of its own since those two economic dimwits Howard and Costello and where were and are the Australian economists and the Reserve Bank of Australia and every Treasurer back to those other two economic dimwits Hawke and Keating—they were all down at the house auction buying another investment property that’s where— not giving a stuff about the younger working class generations contending with rising housing unaffordability in both rent and mortgage, falling home ownership rates and the abomination of 1% of population and rising homeless hoards—in the Lucky Country of all places—and all of this economic vandalism for the income tax benefit of just 8% of the population and most if not all Australian Politicians!
They are not down at the house auction buying up big now— not since Gentleman Jim Chalmers’ May Budget—not on your Nelly—these cowards will be down at the auction trying to unload their investment properties like a bat out of hell to Australia’s young unsuspecting first home buyers—very happy to saddle these kids up big time with negative equity.
For the dimwitted Australian economists that cannot get past the vector autoregression or regression models with interest, population growth rates and every other rate other than the ones that matter shoved into the vectors— who seemingly don’t understand that there are two distinct Australian housing markets—the new build and the established— like Saunders and Tulip of the RBA and that the pre-owned established market decoupled from these economic variables most likely at the Hawke Keating structural break of 1985—here is a salient Figure that might help in understanding dwelling prices. Since the 50% CGT discount—Figure 2 Panel (a) shows real residential property prices, Panel (b) interest rates both fixed and variable (RBA data), Panel (c) population growth rates and Panel (d) unemployment rates—from these graphs— in what economic universe have interest rates, population growth rates and unemployment rates been driving the Australian house price explosions time and time again?
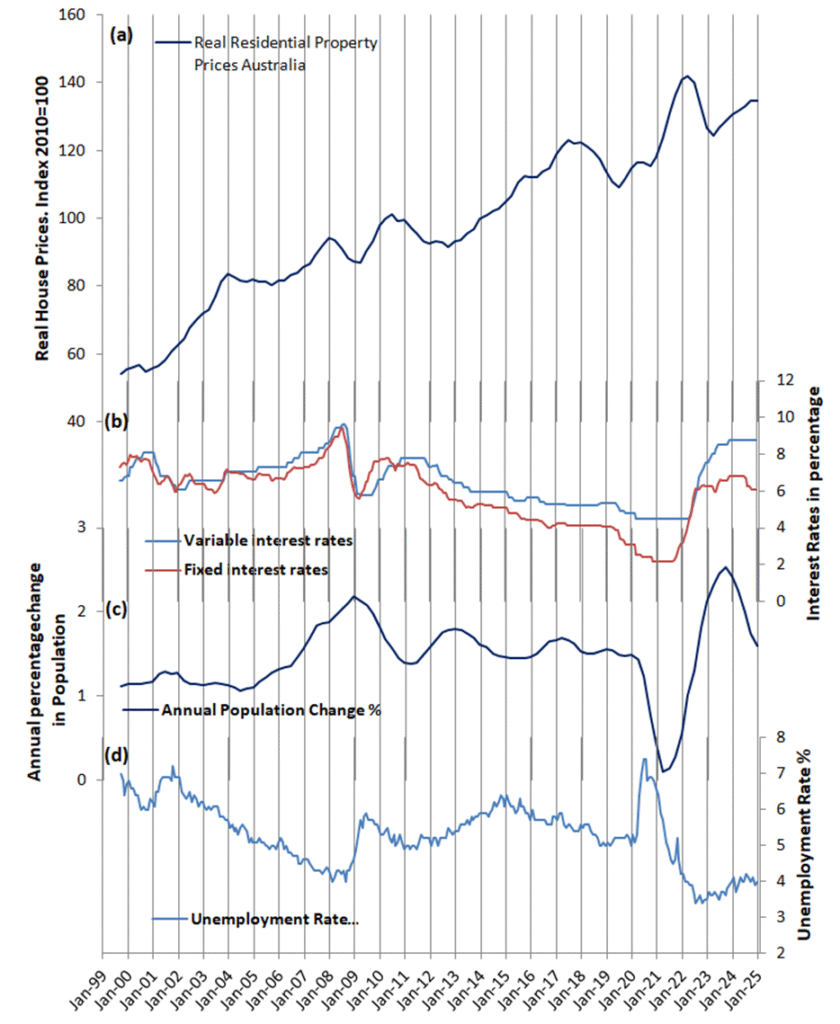
Figure 2. Real Property Price, Interest Rates, Annual Population Growth Rate and Unemployment Rates.
Source Data: Federal Reserve Bank of St. Louis, RBA and ABS.
And another problem with the Saunders and Tulip of the RBA housing model— written into their model is the idiot notion that renting is a choice for everyone who rents—well lads this was definitely the case before the dimwits Hawke and Keating where once upon a time there was this place known as “the Lucky Country” since then that country has morphed into the “Rent Slave State of the Au”—so unlike this dude here or these super greedy rent slavers (Victorian MPs Southwick and Hogett owed 35 investment properties between them “just tryin to get ahead”—millions of young Australian rent slaves have no choice in the matter nor what happens to the paid down principal loan that they the slaves— have payed down—and another thing lads— where is the investor tax concessions market intervention structural distortion in your model—you must be rent slavers yourselves or blind to the structural price brake of 1999-2000 so here is a link for you— the Spanish Government funded a study on this and the Hawke/Keating 1985 structural break— probably “tryin” to defend Au working class children from rent slavery since their own Government MPs are happy to prey upon them the moment they enter their working lives.

And here lads, Ian McFarlane the then Governor of the RBA explained it all back in 2003 in the AGE and this economics paper by Mike Berry & Tony Dalton it beggars belief that RBA and its employees haven’t noticed investors hoovering up an average of 36% of all dwelling purchases across Australia month by month since 2003 when Mr. McFarlane argued this— quoted from the Age article—” since then the growth in home lending – and hence in prices – has been driven by investors, who in turn are “largely tax-driven”— and it has been that way ever since—so I ask you— what is the point of a housing model that neglects housing investors or is happy to see their influence on prices white washed over as a long run trend—get real?
Australia’s housing bubble 4 ways.
In 2013 the OECD declared that the Australian housing market was 37% overvalued (referenced in this RBA paper). They used the Price-to-Rent-Ratio with 1983 as the start year for their reference period average.
1. Using the OECD model and Australian rental data 1980 to 2023 by Abelson and Joyeoux: with reference period from 1983 to 2024 the Australian house prices bubble overvaluation was 110% as at the end of 2024.
2. Using the OECD model and Australian rental data 1980 to 2023 by Abelson and Joyeoux: with reference period from 1991 to 2024 the Australian house prices bubble overvaluation was 66% as at the end of 2024.
3. The Empirical Demand Attribution Price Model: The overvaluation of the Australian housing market was 84% at the end of 2024.
This model used the demand pressure exerted by buyer type on Australia’s fixed supply established housing market where auctions and private treaties are the mechanisms of sale and property transfer. Investors, with rent covering around 70-75% of their mortgage repayments and income tax concession rebates covering much of the rest of the property holding costs— for these people—the cost of holding an investment property per year using an interest only loan structure was less than 10% of owner-occupiers or first-home buyers’ costs. The investor costs increased to the still low fraction of around 20% for Principal and Interest type loans. Unsurprisingly tax subsidised investors easily out bid owner occupier and first home buyers at the auctions and private treaty sales driving prices in the Australian housing market as the paper demonstrated.
Figure 4 from the paper (shown below) is included here— and it is dog simple—the starting point— in a supply limited market increasing demand drives prices up—from there—over any sale period in the fixed supply of listed houses in the “pre-owned established housing market ” predominately made up of Owner Occupiers wishing to up size, down size or relocate, that is, intending to essentially swap one house for another— and where investors placed 80 to 90% of their money — as investors increased their share of total market purchases (this is a direct measure of buyer type demand pressure bought to bear on other buyer types and hence demand pressure on the market) two powerful price drivers immediately evolve— the fixed number of listed houses is driven instantly into under supply— and —“demand amplification”— a wave of displaced owner occupiers must bid harder at subsequent auctions or private treaty sales— against a greater number of themselves and yet more tax-subsidised—rent-covered-mortgage investors and it is here where houses are not allocated on price but on who has more bidding power—“the powerful explosive price growth engine”—furthermore demand amplification permeates the entire market as investors increase their share of purchases, their increasing demand pressure ensures stronger bidding at subsequent auctions and treaties—it is not rocket science—less houses per more buyers—even if they are not present at a particular auction.
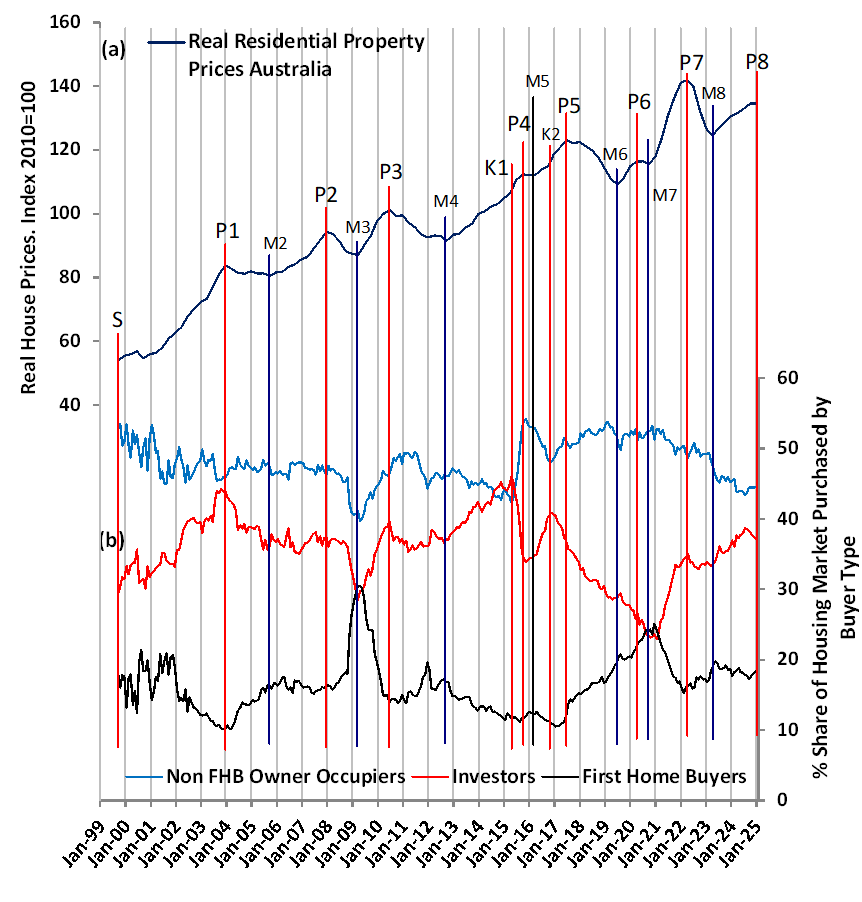
Figure 4. Demand Attribution Price Model Graphs showing Market Price Critical Points and Critical Point Delineators and buyer type demand pressure.
Panel (a): Real Residential Property Prices for Australia. Panel (b): Percentage Share of Housing Market Purchases by Buyer Type giving a measure of buyer-specific demand pressure. Source data: Panel (a) FRED, Panel (b) ABS
Over any sale period in the “pre-owned established housing market” the actual or real supply is limited only to the number of listings of owner occupiers and investors selling up intent on exiting the market, mortgage foreclosures and deceased estates.
First-home buyers play a minor part in the market compared to the other buyer types and only increase their share of market purchases as investors retreat and prices are falling refer to Figure 4.
It is must be noted that around 18% of owner occupiers opt for a newly built dwelling when they sell their pre owned established dwelling which is near equal to the number of first home buyers including immigrant purchases in the established market. Without the tax subsidised investors perpetually hoovering up 36% of the total market, the market would be in near constant supply-and-demand equilibrium with only moderate price growth. How is it possible that this has exceeded the collective economic intellect of every Federal Parliament and RBA Board since Hawke and Keating?
4. The Market Structural Shift Graphical/Regression Model: The overvaluation of the Australian housing market was 87% at the end of 2024.
This model is simple, so simple that even the economic dunces of the Au economic dunce factory— the Australian Federal Parliament might be able to follow along for the sake of Australia’s young people— it is worth a try!
Refer to Figure 5 below—Buried in Australia’s real residential property price history is every economic shock imposed on and endured by the market since 1970. Wars, the Asian Currency Crisis, the GFC, economic downturns, interest rates hikes and cuts, structural tax policy implementations, every house ever bought and sold, the millions of times the tax-subsidised rent-covered-mortgage investors out-bid owner occupiers at the auctions or private treaty sales, population growth and houses built, woeful government after woeful government, the RBA’s “Home Ownership” criminal corruption of 2015, sticky inflation etc., every influence these shocks had on the market is captured in the house price data and economically dimwitted politicians including the property invested ones can “see” this if they just try. For their sake, the squiggles in the blue, black and red lines are not random artistic scribble of a 3 year old—they are a record of buyer responses to these economic shocks reflected in the price that buyers were willing to pay as the events evolved—and the squiggles in the red line— once the investor’s financial advisors and general economic commentary heralded that the coast was clear from possible recession the investors cranked up their powerful “explosive price growth engine” until the next fear of a recession where they shut the big machine down and again waited for the green light.
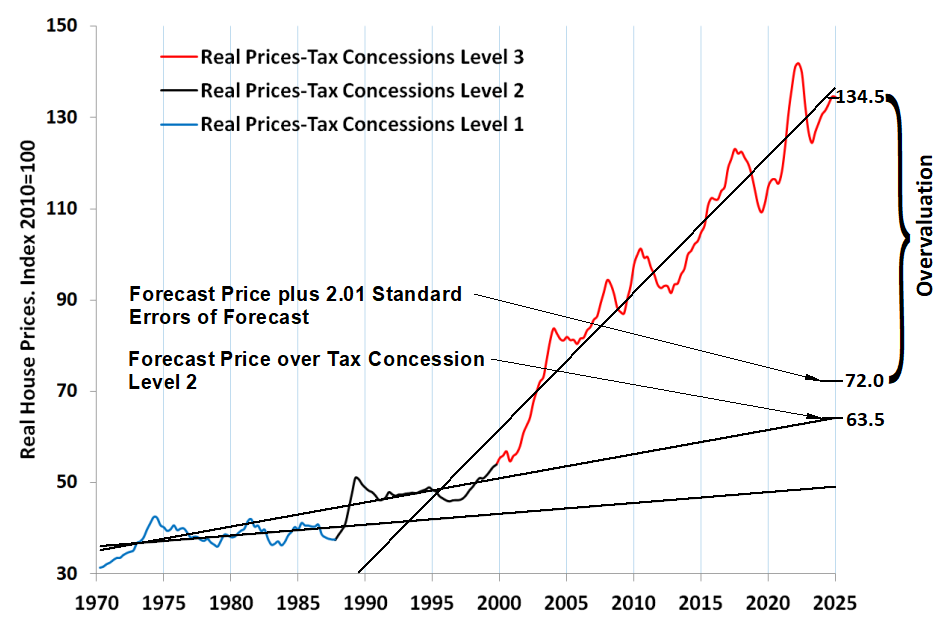
Figure 5. The Market Structural Shift Graphical/Regression Model. Real residential property prices with regression lines through consecutive investor tax concession levels.
Source data: Federal Reserve Bank of St. Louis
The market distortion caused by the added concession of the 50% Capital Gains Tax discount, without accompanying legislated rental restraint, triggered a further wave of investor participation—total market purchases increased 15% to 44% settling to an average of 36% throughout Tax Concession Level 3 (see Figure 4). This surge in investor activity is reflected in the shift of the price growth trajectory from that observed under Tax Concession Level 2 to the significantly steeper trajectory under Tax Concession Level 3, which is loud and clear in the price graph of Figure 5—take a look.
The cumulative price increase over the duration of Tax Concession Level 3 above the counterfactual price forecast of Tax Concession Level 2— is a measure of —tax incentivised investor driven inflation over the period from the 50% CGT discount structural break of September 1999 until the end of 2024, Figure 5 take a look it— is there for all to see.
To calculate the price forecast of Tax concession Level 2, OLS regression lines were fitted to the price data for each tax concession level. The resulting equations are:
Tax Concession Level 3: P = 2.9968x – 5931.8
Tax Concession Level 2: P = 0.528x – 1005
These equations mathematically capture the underlying price trajectory before and after the introduction of the 50% Capital Gains Tax discount which dramatically accelerated the upward trajectory of property prices; specifically, the price growth increased by a factor of 5.7 (2.9968/0.528) relative to the price growth of Tax Concession Level 2.
This clear and obvious structural break in house prices apparently went unnoticed by the RBA Boards and the Australian Federal Parliament but the politicians and Board Members noticed it enough to all get on the “gravy train” and purchase thousands of investment properties over the many parliaments since and recouped all their paid income tax through the 5.7 times capital gains growth rate— and throughout the decades— burying millions of young working class Australian’s hopes of ever owning their own home in the process.
It is clear that Australia is at peak of an extremely large housing bubble—house price would crash if Australians were aware of the extent of the market overvaluation but it is in the interests of politicians, the RBA Board and commercial Banks and their board members and higher paid executives across the land if the market corrects slowly so that they can— Sell! Sell! Sell!—their over inflated investment properties to the ill informed nurses or teachers or other working class Australians if they have not already done so — and so negative equity is looming as a major problem and on a personal level for the young people buying a home for the first time at 40% or more above the actual worth of the property—it will be tremendous setback to their and their children’s lives and not just financially— but a great escape for the investor property owner.
the question is
In this section, “the question is”, questions are asked of members of the governing class that preside over governance of the economy and society at large and who make the governing laws and policies and who ultimately have a profound impact on the life of any given Australian.
Of these people, we have a democratic right to ask questions on governance and we must ask questions and we must insist on answers to these questions otherwise our democracy is on its knees and we are left with no trace of “government for the people by the people” but in its place “government for the political parties, these apparatus of the state for themselves, for lobby networks and groups, conglomerates, media moguls, cronies and the rest by the beguiled and ill informed people”.
Click the “ask the question” button and you too can ask “the question is” of these people.
The question is Mr. Albanese, Mr. Taylor, Mr. Canavan, Senator Hanson, Senator Waters and Governor Bullock— the buck stops with you lot— most of you will have benefited immensely from the growth of Australia’s housing bubble — you will have recouped all your income tax paid with money to spare from your investment property activities all the while fuelling the housing bubble one investment property at a time and since the structural change in the established housing market— that is— the May Budget ridding this market of the abominable 50% capital gains tax discount and negative gearing —aka “the Au rent slave tax laws”—the market must correct—“it’s the economy stupid” —why with such cowardice do you watch on as Australia’s young people buy their first home when severe negative equity is the only outcome for these kids—and not one word of warning?
Have you all by now unloaded your investment properties and sold off your Bank shares as Mr. Comyn of the CommBank did?
Have you joined in the “pile on” and shorted Australian Bank stocks big time?
Mr. Comyn, Mr. Miller, Mr. Irvine, Mr. Matos and Ms. Wikramanayake as the chiefs of Australia’s largest banks you will have been aware of the growth of the Australian housing bubble for quite some time, since 1999 to be exact and you will also be aware that a severe price correction is more than likely especially since the May Budget— yet you are happy to saddle Australia’s young people up with mega mortgages on their first home purchases this very day—in the events of a severe correction and these kids find themselves in substantial negative equity, do you have any plans in place to ameliorate the financial concrete boots these kids are contractually cemented into by you?
Banks lending to home buyers and in particular first home buyers during a housing bubble is unconscionable conduct at the very least and may well be deemed to be unfair business practice especially after the investor concession curtailment in the pre-owned established housing market handed down in the May Budget. You the Banks would know that the 3 real house price index points per year capital gain will have instantly evaporated—your economists will have informed you of this outcome and informed you that a severe price down turn or worse is inevitable—to insist that the home buyer you lend to is as economically well advised as you are is unreasonable and by the very fact that he or she hands over his or her hard fought, hard saved, only money they have in the world, precious deposit to you since the May Budget is testimony to the fact— that they are not economically well advised as you—they have not got access to their very own 20 strong economists economics department and they are listening to Dr. Ellis for WestPac on the ABC August 12th —at the very least it is immoral wouldn’t you say?
In any case when a single heavily indebted negative equity borrower shows up at your headquarters demanding an explanation and charging you with unconscionable conduct you will have him crushed under-foot like a cockroach but when a hundred thousand show up you may have to cultivate some manners.
Mr. Comyn, Mr. Miller, Mr. Irvine, Mr. Matos and Ms. Wikramanayake any comment by you or your bank’s representatives over the last five years that have talked up the Australian housing market including Dr. Ellis for WestPac on the ABC August 12th “everything is Hunky Dory” appearance expecting a drop in house prices of around 10%—only 10% —may be able to be used against your banks in class actions bought by your share holders in the event of a share price collapse— for decades— down playing the growing housing market overvaluation and lending in a growing and financially dangerous overvaluation is not exercising fiduciary responsibility towards your shareholders —wouldn’t you say?
Mr. Comyn, Mr. Miller, Mr. Irvine, Mr. Matos and Ms. Wikramanayake if the banks have lobbied Federal Members of Parliament or Political Parties and been successful in persuading them to maintain the two housing bubble growth tax concessions —that is—negative gearing and the 50% capital gains tax concession across the new build and established housing sectors— say like prior to the 2016 Federal Election and any time after or since September 1999, then the banks bear direct responsibility for the growth of this extreme housing bubble—not in full but in significant proportion—this is just a fact and any “reasonable person” would come to that same conclusion—this may be a chink in your legal armour—wouldn’t you agree?
Dr. Ellis you were with the RBA in 2015 when the RBA made a submission to the House of Representatives Standing Committee on Economic (the Committee) enquiry into Home Ownership in Australia. The RBA submission sought to show that the housing investor tax concessions of negative gearing, the 2.5% depreciation allowance and the 50% CGT discount were not having a detrimental effect on Australia’s homeownership rates when in fact— these concessions had sent the steadily upwards growth in homeownership rate into instant decline, see not 3 in Figure below.
Dr. Ellis, aside from the persuasive text conveying this wrongful and misleading message in the Submission, the Bank presented a graph using manipulated ABS Census data— the authors tell us exactly this with their Star Note * under the graph but the 1986 and 2011 homeownership rates were entirely falsified which they did not mention—once this Submission was handed to the Committee, a crime under the Parliamentary Privileges Act 1987 was committed. Please study the graph below to jog your memory.
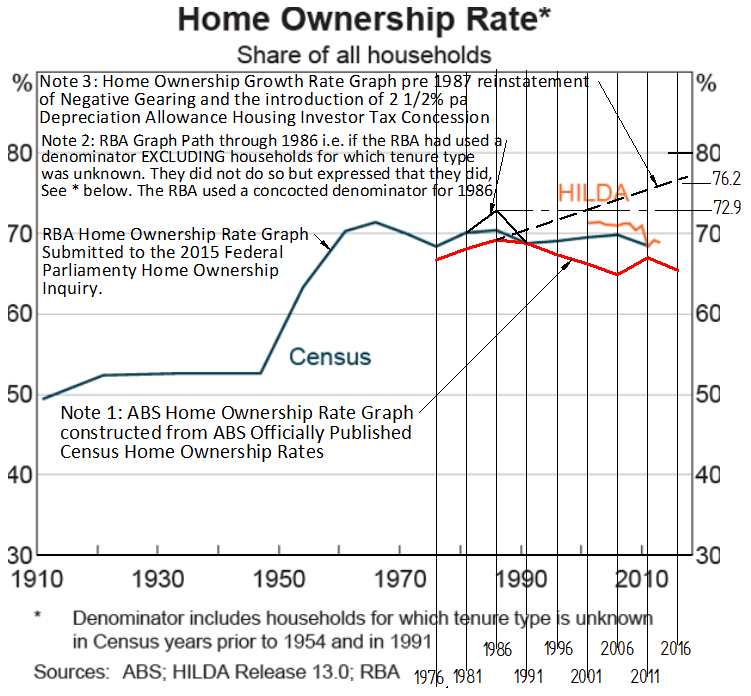
Figure 6. Home Ownership Rate Graph of the RBA 2015 Submission with an overlay of the ABS Census Home Ownership Rates shown red.
Dr. Ellis , this is the RBA Home Ownership Rate Graph from the second page of the RBA Submission with an overlay of the ABS Census Home Ownership Rates shown in red— the Star Note under the graph clearly states that “Denominator includes households for which tenure type is unknown in Census years prior to 1954 and in 1991”. This Star Note tells us the data is being manipulated, the authors of this graph altered the ABS Census rates by omitting “households for which tenure type is unknown” from the ABS denominator for all Census years from 1954 onwards to 2011 with the exception of 1991, this had the effect of lifting the ownership rates by several percentage points and importantly showed the manipulated rates to be increasing from 1991 where as the red graph of the Census data shows rates in decline from 1991, so why do it in the first place?
But more damning Dr. Ellis, if the Star Note denominator is used to calculate the 1986 ownership rate then the rate of the RBA Graph should show 72.9% but it does not—it is clear—the rate shows just over 70%— clearly the authors of this graph used another denominator altogether to hide from public view an alarmingly steep decline from 1986 into 1991 had their Star Note denominator been used. The 1986 denominator was completely falsified —there is no other Star Note anywhere in the Submission explaining how the denominator was arrived at—maybe the autors just kept adding “tenure unknown“ to the denominator until the rate was low enough to suit the general deception of the graph and the entire Submission—altering the denominator is such away is still using ABS source data but results in a criminal falsification of that data.
The same goes for the 2011 ownership rate, a completely different denominator was used here to lower the rate by ½ a percent to be near coincident with the HILDA Data of 2011—to be right on target with the HILDA data adds credibility to their falsified Graph— wouldn’t you agree?.
Dr. Ellis why were the 1986 and 2011 rates falsified and all rates from 1954 onwards manipulated with the exception of 1991—what was the point other than to hide from the Australian people the fact that the housing investor tax concessions were causing a decline in home ownership rates— and in over half a century of Census data what was so special about 1991—from the simple mathenatics that the authors were using to deceive the Committee and therefore the Australian people—the reason is blatantly obvious—wouldn’t you agree Dr. Ellis ?
Dr. Ellis this criminally falsified and misleading Submission had something to do with the 2016 Federal Election and as you know Labor were intent on curtailing the housing investor tax concessions if they were to win the Election and as you know also Labor lost the election by just 0.72% of the vote TPP.
Dr. Ellis it would have taken an awful lot of political clout to organise such a thing and then to have the gall to submit it to the Committee Members knowing that it contained at least 2 easily verifiable falsifications of ABS Census data—and were Australian Banks in on it?
Dr. Ellis how could the RBA Governor and Board hold the people of Australia— and who paid the Governor and the Boards’ considerable salaries mind you—in such contempt as to hatch such an election altering plan and then to actually carry it out?
Dr. Ellis should these questions be asked of Glen Stevens or the present RBA’s Governor Bullock?
Dr. Ellis here is something that you will know about though— it was a question asked of you by Senator Giles during the Committee’s Home Ownership Enquiry and your response to him some time later:
Mr GILES: It in part touched upon the commentary of the RBA, the then-most-recent minutes of the Reserve Bank board, which presumably would be March or thereabouts. The commentary is:
The speculative nature of Sydney’s residential investment property, affected by negative gearing and the CGT discount, is making interest rate changes less effective. The consequences of this might be that the Australian economy is deprived of further monetary policy stimulation and remains weaker for longer because negative gearing and the CGT discount encourage speculative behaviour in the housing market.
Do you have any comment on that, or is that perhaps a matter you might take on notice?
Dr Ellis: I am not familiar with the specific wording. There are a lot of reports to keep on top of, so I think I would prefer to take that one on notice.
Our response is: “The Reserve Bank Board takes a range of factors into account in its monetary policy deliberations. The reasoning behind its decisions is published in a statement immediately after each meeting and subsequently in more detailed minutes. The specific rationale discussed in the quote has not been mentioned in recent issues of these documents.”
Kind regards
Luci Ellis
Luci Ellis | Head of Financial Stability Department
RESERVE BANK OF AUSTRALIA | 65 Martin Place, Sydney NSW 2000
So the RBA Board is informed that, “negative gearing and the CGT discount, is making interest rate changes less effective”— the root cause of sticky inflation and ”the Australian economy is deprived of further monetary policy stimulation”— so the entire economy and not just Sydney is affected and “negative gearing and the CGT discount encourage speculative behaviour in the housing market”— the tax concessions are housing bubble drivers.
And to these alarming economic revelations the RBA’s response delivered by you— The “specific rationale”— “has not been mentioned in recent” detailed Board minutes.
And that is it!!!—From the preeminent Economic Institution of the Nation on such grave economic matters—this simply beggars belief!!!
And yet with this damning minute extract detailing the economic damage being rained down upon the Australian people and their economy by “negative gearing and the CGT discount encourage speculative behaviour in the housing market”— the RBA Board at the time proceeds with their criminally falsified RBA Submission to the Committee with its deliberately deceitful message of “home ownership rates have been broadly stable at around 70 per cent since the 1960s, and furthermore the RBA has watched on as this “speculative behaviour” has driven the market into a severe overvaluation ever since—refer to Figure 5—how on earth has the RBA allowed this to happen Dr. Ellis?
Dr. Ellis the behaviour of the 2015 RBA Governor and Board and Governors and Boards ever since is nothing short of —egregious and dangerous economic vandalism—and for the tax benefit for themselves and just 8% of the population—wouldn’t you agree Dr. Ellis?
Dear Bankers, Dr. Ellis and Politicians, would not it have been best to deflate the bubble in 2016—sure you the “governing class” would have lost a decade of preying upon the governed with your —rent slavery underpinned income tax minimisation/recoup scheme—but the bubble is so big now it is a clear threat to the financial stability and the economy?
And a question to our leaders of the Nation’s disappointing and economically incompetent Political Parties—resource rich and a $Trillion debt for instance—do you even get the concept— or were you labouring under the economic nutterism that house prices could hit the moon without economic consequence or was it simply greed on your part— investment property tax minimisation/recouping of your income tax paid at the expense of responsible economic stewardship—like Tony Burke with his four investment properties as housing unaffordability increased or these other two greedies, home ownership rates fell, homelessness increased, sticky inflation grew stickier and the bubble more frightening—well done Mr. Burke and your MP mates —you have done your part in killing off the Great Australian Dream big time—how grubby you all are though when caused to think about your greedy rent slaving behaviour?
ACTU President O’Neil, it is clear that Australia’s working class and their children are being preyed upon by the governing class who surreptitiously are “just tryin to get ahead” like Tony Burke and Senator Hanson” standing on the necks of their tenants while they are “just tryin to get ahead” killing off the chance of home ownership for nurses and teachers and their children while the governing class keep on “just tryin to get ahead” buying another investment property time and time again “just tryin to get ahead” .
Ms. O’Neil, this “just tryin to get ahead” has been going on for 40 long years under the guise of “mum and dad investors just tryin to get ahead”, 60 % of all housing investor loans were interest only loans aka “capital gains churn loans with no intention of full ownership”, APRA put a limit on the number of investors who could take out these loans in 2017 then removed the limit 16 months later on January 1st 2019—the governing class would not tolerate such an impost on their income tax minimisation/recoup scheme for too long and furthermore since Hawke/Keating— these “mum and dad investors just tryin to get ahead” have purchased over 5.7 million homes and resold 4.3 million— and when they got started there were only 5.8 million homes in the country. This 4.3 million homes is capital gains churn —that is —2 in every 5 houses in the country has been bought and sold for capital gain income tax minimisation/recouping by high salary earners like our politicians at the expense of housing affordability for the working class—8% of the population has smashed home ownership to oblivion for millions of working class Australians—“mum and dad investors” what total rot—that is the guts of it.
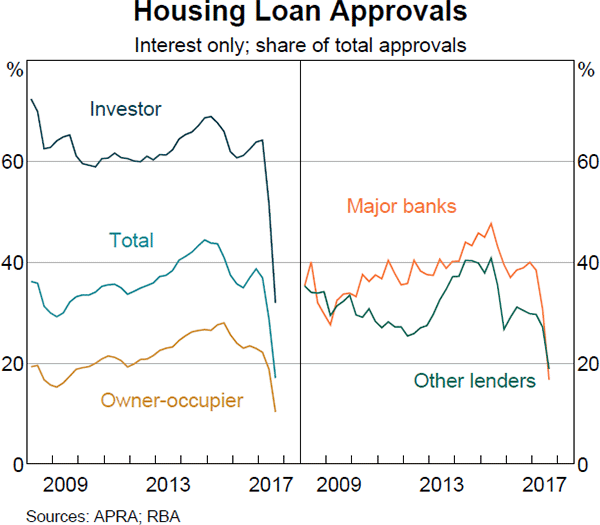
Ms. O’Neil the numbers are staggering —since these greedy people got started— they have purchased 5.7 million dwellings, sold 4.3 million, own 2.88 million adding 1.38 million to the 1.5 million they started with and with the 2.33 million they live in— these people own 5.2 million dwellings and —through present ownership or capital gain resale—these people have had their hands on over 9.5 million properties —there are only 11.5 million dwellings in the country this very day.
Do you get the picture— if investors lived in cardboard boxes or in derelict cars the housing pressure would be much less but they do not so and if you count their place of residence— they own— half the housing stock in the land —that is every second house is owned by a property investor—take out the properties they live in—and near on one in every three of these properties is a tax subsidised investment property—as any fool can see—investors have put relentless pressure on the housing market for decade upon decade— and at the cost of millions of Australian working class kids—unreal!!!
The ACTU is calling for “two years of housing security as the default standard”, this is wholly inadequate —the investment property market is the rental market—for an investor it’s the investment property market and for a renter it’s the rental market— these markets are one and the same—the governing class gave themselves 3 powerful tax concessions that have allowed investment properties to be held at 10% of the holding cost of that of owner occupiers, they also demand that renters pay 70 to 75% of their investment property mortgages—insisting on favourable market intervention for themselves and a “free market” for renters—that’s right no favourable intervention for the renters—the gall of these people is staggering—and make no mistake the investment property/rental market as it has been and is set up now— i.e. without rental restraint is underpinned by the practice of slavery—rent slavery —with the powerful shackle that binds the tenant to the landlord— the necessity of housing—there is no other rental market for these people— they are trapped!
The ACTU must insist on a renter market intervention counter balance to the—investor tax concession market intervention— in the form of legislated rent limits and this would be fair and just intervention that defends the working class from rent slave poverty and eventual homelessness—in short they would be able to save and buy their own home rather than paying down some greedy’s umpteenth investment property mortgage.
President O’Neil there are several requirements that the executives of all workers unions need to do to stop the working class from being preyed upon by their MP’s and other governors—it is a fundamental imperative if the wellbeing of the working class and their children are to be defended against the grotesque behaviour of these people:
- Every union member needs to be informed of— the wonton economic vandalism of the governing class— using housing for a tax minimisation/recoup scheme for themselves and just 8% of the population for 40 long years driving housing unaffordability to the grave level it is now at—and they are still at it in the new build sector—8% of the population, 8%, 8% of the population—you have to beat the drum very loudly.
- Every union member needs to understand the imperative of a renter market intervention counter balance to the—investor tax concession market intervention—they must vote for legislated rental restraint of 25% of the investment property mortgage or “valued at mortgage”, then they can buy their own homes rather than pay off yet another investment property for yet another greedy MP.
- Every union member needs to understand the need of clearing the parliaments of these rent slaving property investor politicians for the sake of their children, the economy at large and the Nation—Tony Burke is a good place to start—get rid of that greedy, socially and economically Nation damaging so and so! Tell that Labour outfit—field another candidate other than Greedy Burke or the labour movement vote goes to an independent in that seat or all seats if necessary.
- Make the abolition of the rent slave tax laws, legislated rental restraint and clearing the Nation’s Parliaments both Federal and State of property investor politicians front and centre voting demands as a matter of course in the lead up to and at both State and Federal Elections.
- The union movement must be prepared to back independents over Labor if necessary to put a stop to the governors preying upon the goverened.
Ms. O’Neil the ACTU’s call for just “two years of housing security as the default standard” and not to call for legislated rental restraint and to not systematically make the abolition of the rent slave tax laws and rental restraint— voting issues loud and clear at every Federal and State Election since Hawke and Keating and especially since Howard and Costello, begs some very important questions and the first one is why have not— these issues been central voting issues at every past election?
Ms. O’Neil are the well paid union movement executives infected with the same investment property cancer as the governing class— are these executives investment property owners— are you an investment property owner and would this explain the roaring silence on legislated rental restraint— on the abolition of the rent slave tax laws— on the fact that just 8% of the population has caused increasing housing unaffordability since Hawke and Keating — why isn’t —the tax benefit of just 8% of the population which is the very cause of the unaffordability crisis— not called out and drilled into the consciousness of every union member?
Ms. O’Neil is the union movement executive riddled with investment property cancer like the Nation’s Parliaments, the RBA, the banks etc., after all as executives you too are a form of well paid governing class?
Mr. Albanese, Mr. Taylor, Mr. Canavan, Senator Hanson, Senator Waters and Governor Bullock if you do not understand the economic mechanism between the high cost of housing and the need for high immigration which is causing the one thing that will wipe out small business time and time again— ever increasing commercial rent— then you are not economically smart enough for your seat in Parliament or the RBA Governorship—do the country an actual service and resign.
Paul Keating, John Howard and Peter Costello you along with that Bob Hawke are all traitors to the Lucky Country—traitors to this Country and its working class citizens and you are gutless beyond belief— the four of you— knew that the 1985 Keating/Hawke two additional housing investor tax concessions to negative gearing of the 4% depreciation allowance (reduced to 2.5% in 1987) and the Capital Gains Tax payable on real capital gain only— had sent the healthy home ownership growth rate of 1976-1986 into instant decline—you turned it backwards— you knew this because it was picked up by the 1991 Census—see the red Census Graph overlay on the RBA falsified Graph of Figure 6—at that juncture, what did you do about it— nothing— you watched on as your structural price break of 1985 took hold and rolled on, see Figure 5 Tax Concession Level 2—at this juncture you all knew that rent slavery had begun—and then on top of this working class catastrophe— Howard and Costello you gave high salary earners their income tax minimisation /recoup scheme of the 50% CGT discount in place of Keating’s CGT concession structure in 1999—you gave investors their “powerful price growth engine”—the housing bubble machine—and the four of you are the architects of the housing unaffordability calamity facing working class Australians this very day—unaffordability that has over the decades denied millions of working class young Australians a chance of a home of their own—no Great Australian Dream for those kids —the four of you are the architects of “the Rent Slave State of the AU”—THIS IS YOUR LEGACY YOU GUTLESS WONDERS—you buried the Great Australian Dream for millions of working class kids—you killed off the Lucky Country—for the tax benedit of just 8% of the population.
Some of your handiwork aside from the biggest housing bubble of all time on a per capita basis:
Lowest housing affordability on record
A woman and her family under brutal rent stress and unknown housing tenure—Ahh that’s right Keating, Howard and Costello she’s a working class woman— she deserves to be a rent slave for the likes of you—it’s her station in life!
People living in poverty to pay off your investment property mortgages —cowards! Ahh that’s right Senator Hanson you have to wipe out the ABC and SBS to stop citizens reading about the likes of you standing on the necks of everyday working class Australians while you and the chosen 8% are “tryin to get ahead” forcing them, through the necessity of shelter to pay off your mortgage for you— and like your interviewer—you rent slavers don’t even care about these less well off Australians—they are shite to be walked allover just so long as you are “gettin ahead & gettin ahead & gettin ahead”—and I ask you Ms. Hanson on behalf of the working class kids whose necks you are “standin” on while you are “gettin ahead”—while these nurses and teachers are paying off the bulk of your investment property mortgage—how are they ever to save and get ahead ever—How?—“Please explain”?!!!!!!!
The homeless women of Australia—Look!!!!!!!!!! — Charities are defending these women against your handiwork you gutless wonders and you are old enough to know that the only people at risk of homelessness before you bought this hideous “Rent Slave State of Australia” into being with your economically and socially damaging housing investor tax concessions were alcoholic men—yet you accepted your politician’s salaries and your pensions —the gall of you so called leaders is astounding.
Keating, Howard and Costello and the dead Hawke— THIS IS YOUR LEGACY—a legacy cherished and protected by near on every Australian politician since your time in that investment property corrupted place.